
New findings from research by Uptime Institute Intelligence reveals that organizations can cut both their cloud carbon emissions and costs by moving workloads to different regions. However, the trade off with this migration is an increase in latency.
Why keep loads local?
Cloud users choose regions based primarily on two factors:
- Locating the application close to end users improves the user experience by delivering faster content. Some applications, such as interactive gaming, require very low latency, which is driving cloud providers to invest in new edge locations close to end users. Not all applications, however, need such a quick response and end users can often tolerate a slight increase in latency without material impact to their experience.
- Offering cloud-based services in a country usually has implications regarding data protection and this can be partly addressed by keeping data within the same jurisdiction as their end users.
If there are no legal reasons to keep data in a jurisdiction, cloud users can often migrate their workloads to a nearby region and gain reductions in their carbon footprint; this migration can also result in lower costs. Uptime Intelligence collated information from Microsoft Azure, Amazon Web Services (AWS), Google Cloud, the Cloud Carbon Footprint project (which sources data from carbonfootprint.com, the European Environment Agency and the US Environmental Protection Agency) and CloudPing to produce the Cloud Carbon Explorer, which includes three interactive maps.
The maps show the potential cross-region workload migration paths for AWS, Google Cloud and Microsoft Azure. These workload migration paths can reduce carbon footprint without significantly impacting user experience and, in some cases, reduce cost. Users can use the tool to explore suitable compromises of latency, cost and carbon for each application.
We found 38 migration paths between AWS regions that provide both carbon and cost reductions with a latency impact of less than 100 milliseconds (ms). For Google Cloud, there were 39 migrations paths and for Microsoft Azure there were 15 migration paths, all with a latency impact of <100 ms.
An example: leaving Frankfurt
Figure 1 shows the tool’s analysis of possible workload migrations from AWS’s Frankfurt data center. The Carbon Cloud Footprint project estimates AWS's Frankfurt data center to have relatively high grid carbon emissions compared with the rest of Europe. Migration to Stockholm, Milan, Paris or London all provide significant reductions in carbon and cost, with a maximum increase in latency of 30 ms.
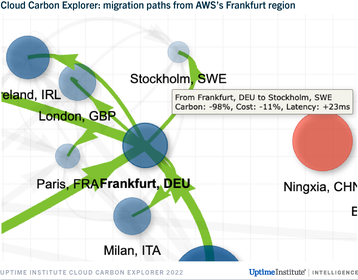
The bubble size in Figure 1 represents the grid carbon emissions, and the thickness of the line represents the latency impact (wider equals slower). For example, clicking on the migration path pointer from Frankfurt to Stockholm shows a potential 98 percent cut in grid emissions. The color of the line indicates impact to cost, with green representing a cost saving (not shown in this example: yellow lines representing less than five percent cost increases).
Users can also make carbon and cost reductions when using Microsoft Azure or Google Cloud. For instance, the Cloud Carbon Explorer shows that by moving a virtual machine from Google’s Hong Kong data center to Taiwan, grid emissions drop 14 percent and the cost of an e2-standard-2 virtual machine decreases by 17 percent. The trade-off is a slight increase of round-trip latency of 13ms. In another example, Microsoft Azure users can reduce carbon and cost by migrating their workloads from Iowa (US) to Illinois (US). For a slight increase in latency of 13ms, the cost of a D2as_v5 virtual machine drops by 12 percent and grid carbon emissions decrease by 17 percent.
It's not always simple
The Cloud Carbon Explorer provides indicative carbon, cost and latency figures based on various assumptions. A lack of data is a significant problem for users in calculating their cloud carbon footprints. This difficulty in acquiring the appropriate data is the reason Uptime Intelligence have used third-party sources and were not able to evaluate all regions for all cloud providers.
In addition, the individual characteristics of specific data centers (such as power usage effectiveness - PUE - variations) have not been considered due to a lack of comprehensive information. Although the analysis is imperfect, it does demonstrate, however, that there are suitable trade-offs to be made.

Issue 46 - The Last Data Center
Long-term data storage enters a new epoch
Organizations should commit to cutting carbon emissions, partly for regulatory reasons and also because sustainability is high on consumer and corporate agendas. However, moving region isn't always simple, and there are legal and latency repercussions to consider. As discussed in the Uptime Intelligence report How resiliency drives cloud carbon emissions, before users consider migrating workloads, they should investigate whether the application can be tuned to reduce carbon.
The next step for users to reduce their carbon (and cost) involves the choice of data center. Users need to balance the benefits of carbon reduction (sometimes coupled with a cost reduction) against the impact of a latency increase.
Uptime Intelligence believes the third-party data sources used in the Cloud Carbon Explorer are reliable and fair, but we have not audited them in depth. Users should use the interactive maps to evaluate feasible migrations before performing their own more detailed assessments. Our analysis suggests that these investigations are worthwhile, given the potential savings in both carbon and costs.


