
A recent market research rport from Frost & Sullivan has estimated that $432.14 billion will be invested in the data center market annually, by 2025. This is up from $244.74 billion in 2019, giving a CAGR of 10 percent. The increased investment will be from data center operators, builders and designers, looking to capitalize on the deployment and usage of IoT, Big Data, and AI. Strong growth is expected in emerging economies with the Asia-Pacific region seeing the largest growth.
This means that designing and operating data centers that are energy and resource-efficient is a priority. A small increase in overall system efficiency can add a significant return on investment for a data center asset. Traditionally, data centers have been very energy-intensive and most cooling has been provided by electricity-hungry chillers and similar equipment. Recent trends have moved towards low-energy cooling methods, using natural heat sinks such as the surrounding air or a water source. Many data centers have been built in colder climates to mitigate energy demands for thermal management and some net-zero data center operations even divert excess heat to meet neighboring heat demands where low-grade heat is precious, such as homes and offices.
Driven by simulation
These recent trends in more energy-efficient data centers have been enabled by correspondingly more accurate simulation models of how the system works. Simulation and modeling of a data center building, equipment, and operation is a way of capturing the main energy and environmental characteristics of a particular design. This model is then simulated against a set of climate and other variables, to predict its performance in the real world. Simulation tools give designers the ability to run multiple design iterations and define a rigorous and physics-based probabilistic performance of a building. To do this requires analysis tools that account for the physics of heat transfer, cooling, airflow, and various product and material properties. Options analysis at early stage design to evaluate multiple designs quickly before the design becomes too detailed and difficult to change is a key benefit of modeling. Engineering simulation is a type of analysis used by engineers to model and simulate the performance of data centers.
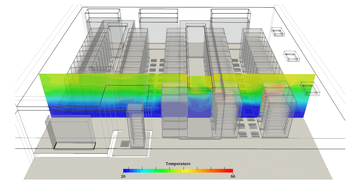
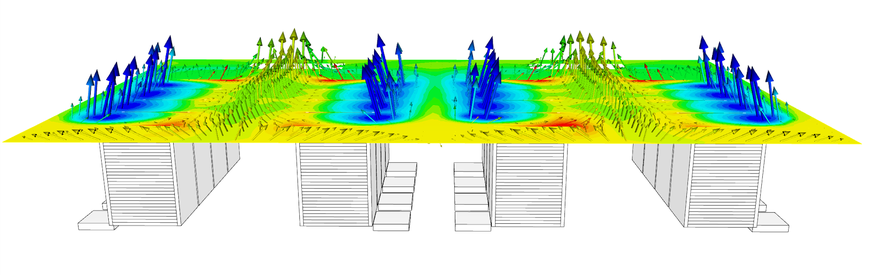
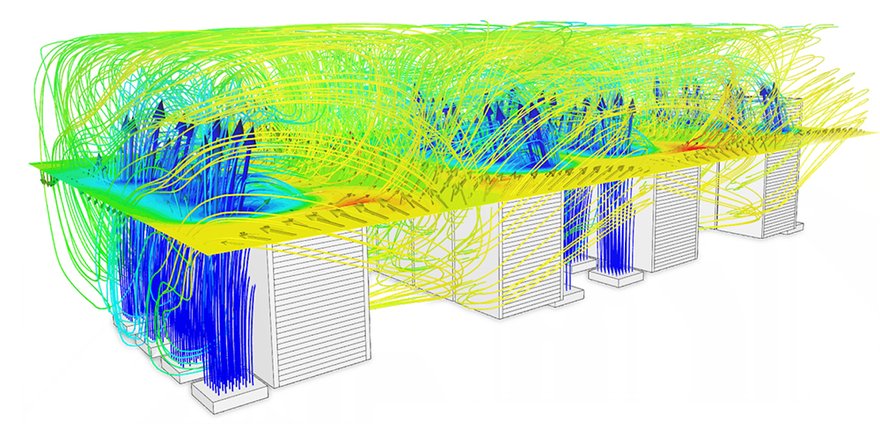
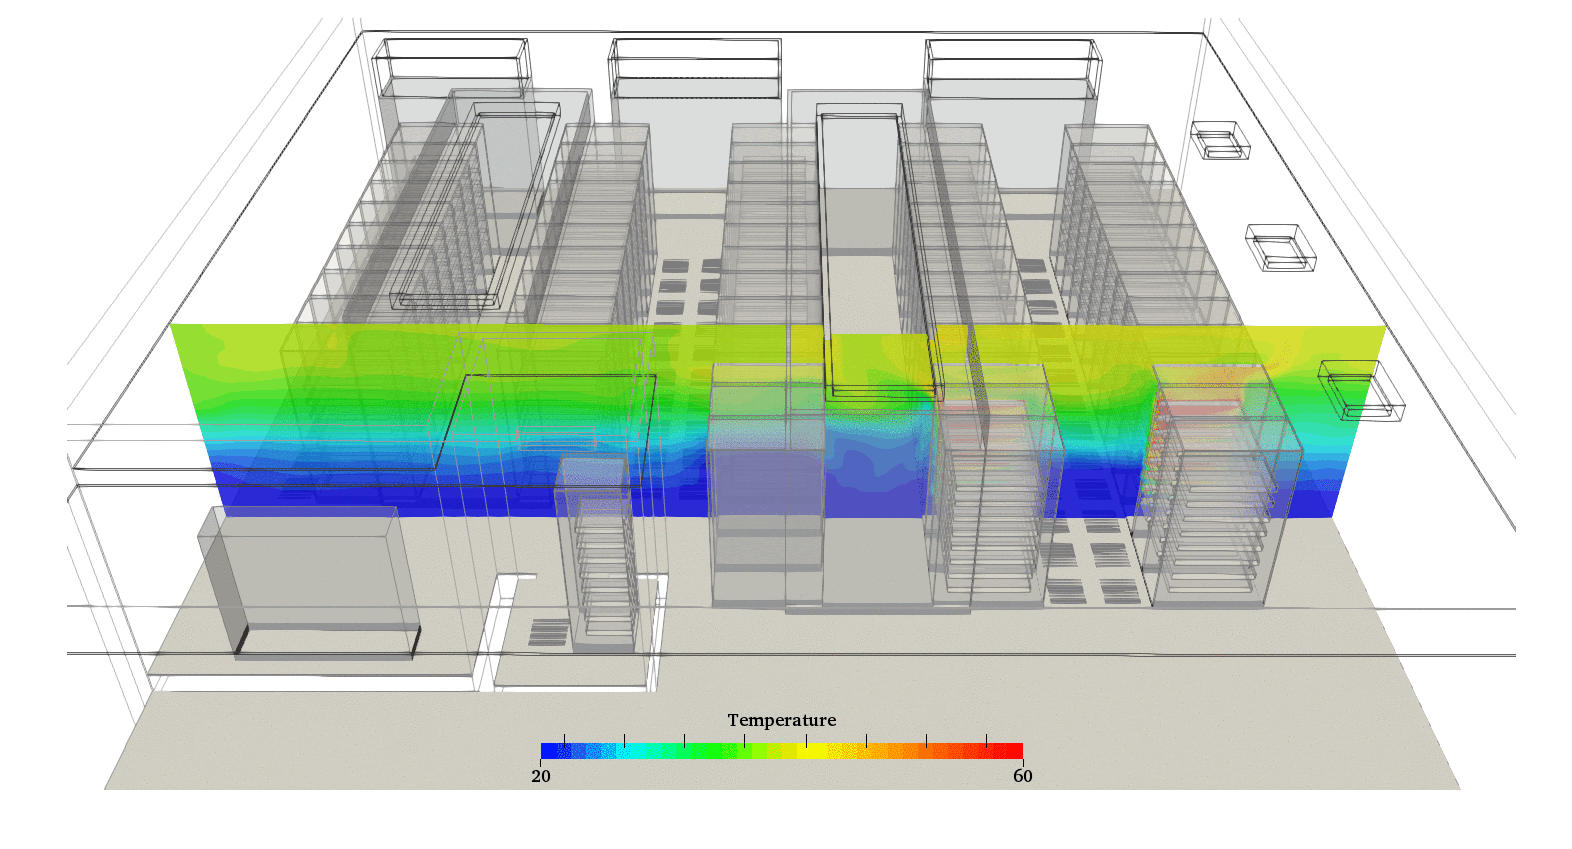
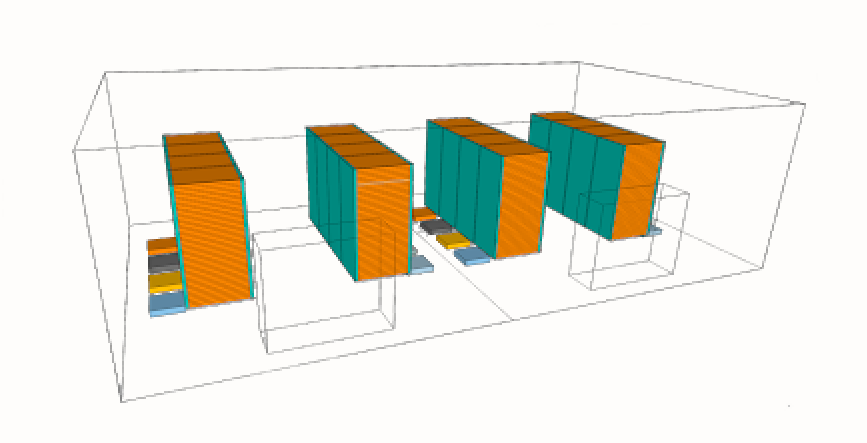
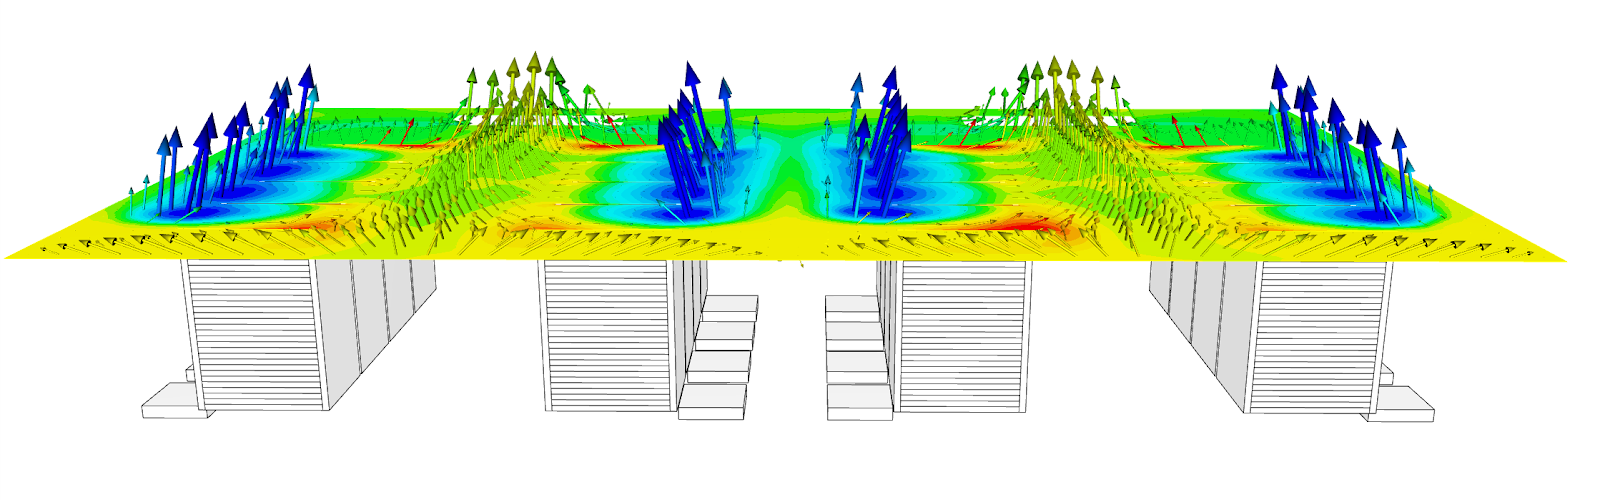
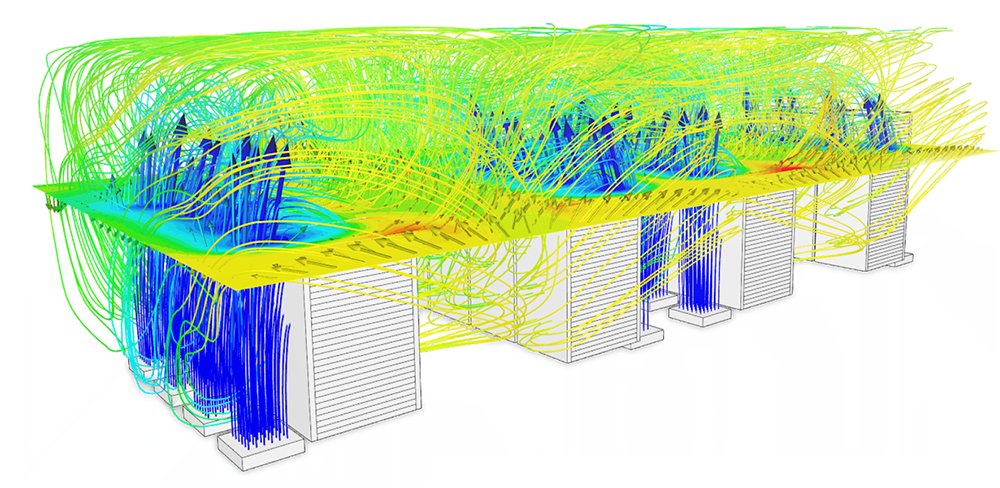
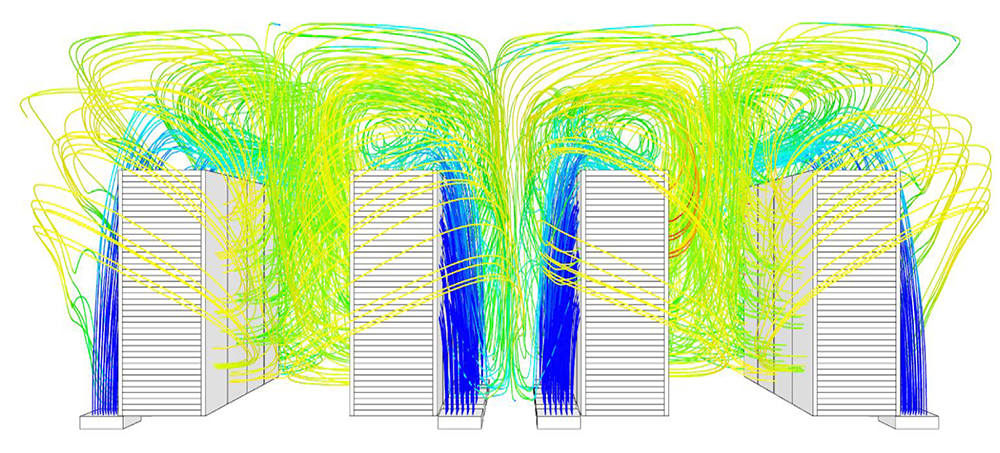
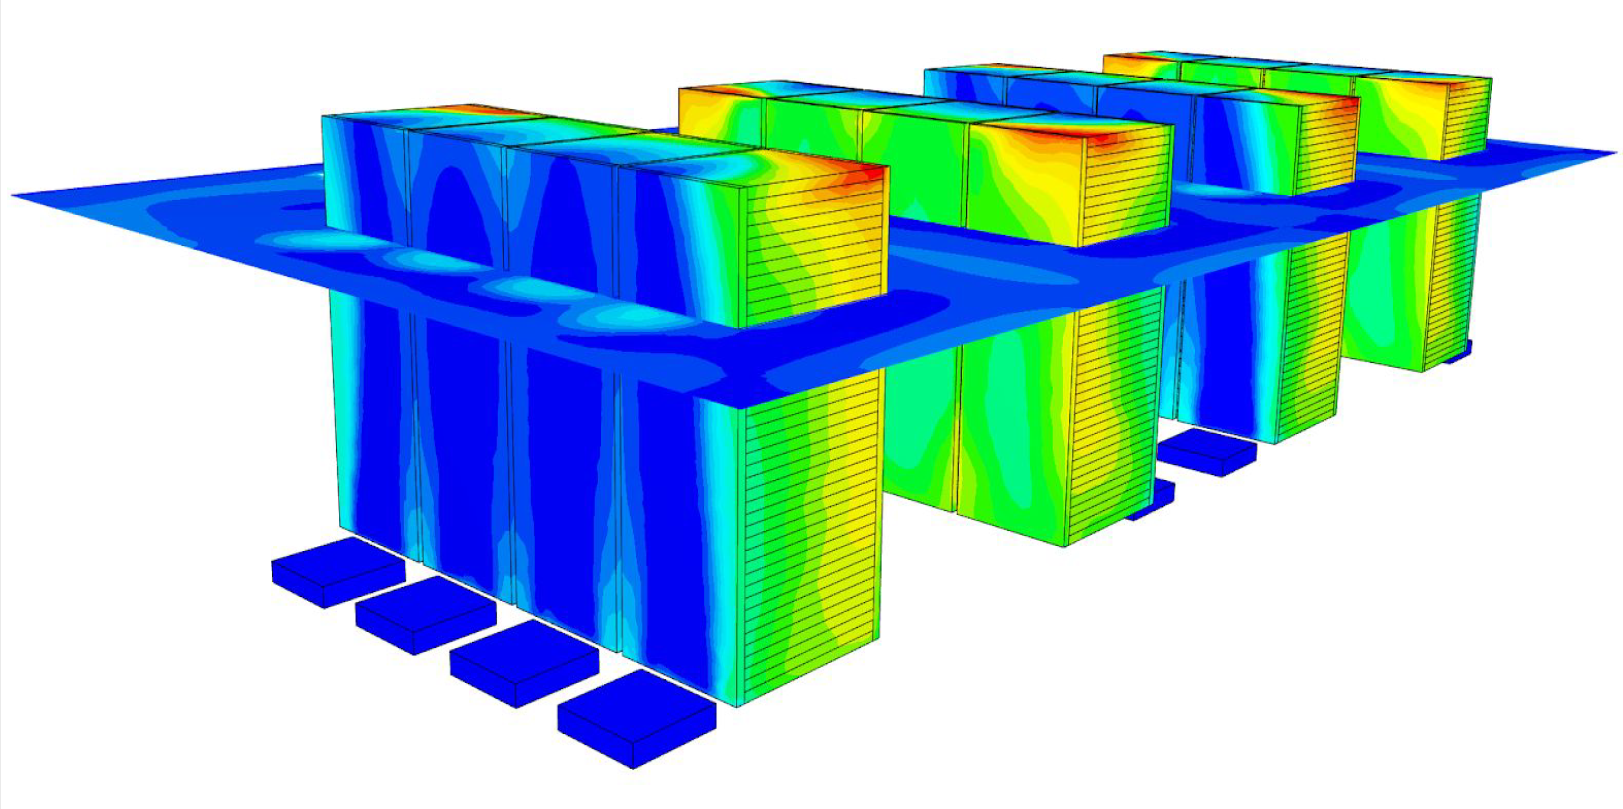
Figure 1 illustrates the results from a Computational Fluid Dynamics (CFD)simulation of a data center. In these images, the analysis is conducted to understand the temperature distribution in the space, specifically the interaction between the cold and hot aisles. A CFD visualization in the vertical or horizontal plane can give an engineer insight into the three-dimensional domain inside a data center.
Engineering simulation on the cloud
CFD is a type of engineering simulation that models the behavior of fluids (liquids and gases). A 3D model of a data center, for example, is used to simulate the physical and thermal properties of a data center setup. CFD models the primary mechanisms of heat transfer — conduction, convection, and radiation—and can show the impact they have on the thermal performance of any building or equipment. The workflow is enabled through a cloud CFD platform that can run multiple simulations in parallel. This minimizes the time taken to properly examine all necessary scenarios within a problem domain, which can be in the hundreds. With parallel run capabilities, all possible design scenarios can be simulated at the same time. CFD is useful to gain an understanding of:
- The flow characteristics of existing designs to highlight inefficiencies e.g recirculation and isolation regions in between aisles or CRAC units.
- Distribution of air temperature at different locations
- Equipment temperature
- Identification of hot-spots or zones
- The comparison of design changes and what-if scenarios
The model of a data center that can be simulated includes:
- Multi-Part CAD models
- IT-Server equipment (heat sources): surface power, volumetric power sources
- Server cooling fans (driving flow inside racks) or other inlet/exhaust fans: fan flow rate via momentum source, easy specification using geometry primitives of various types (No CAD modeling required)
- Air inlets and outlets and other ventilation equipment
- HVAC equipment
The Value of simulation
To understand the value of CFD simulation, we can look at a simple data center case. In this example, a traditional, small, open aisle data center is simulated. The model has underfloor cold air supply by two chiller units. Cold air is supplied at 20 ℃. The room has 16 x 42 units of server racks. We are interested in finding out the following:
- The temperature distribution, identifying hot areas
- The flow pattern, ensuring each server rack gets fresh, cold air
- Whether exhaust air is interfering with cold aisle operation and mitigating accordingly
The series of images below highlight the quick steps taken to achieve a useful output. Various thermal results are available instantly when simulating on the cloud.


Summary
CFD simulations can give the engineer the ability to quickly model multiple configurations of data center design. More importantly, it allows a designer to properly evaluate the thermal, airflow, layout, and equipment performance of the data center. Accurately predicting the performance of a system provides critical information that feeds into financial considerations such as return on investment and payback, meaning correctly defined models and engineering simulation software are powerful tools in the design of future data centers..
